

Baseball Performance Analysis
Overview
The data set contains the performance of baseball players like number of home runs and batting average. It also contains physical attributes of the players like height, weight and handedness (Left, Right or Both handed). I will provide univariate, bivariate and multi-variable visualization to gain some insight into the performance of the players.
Design:
-
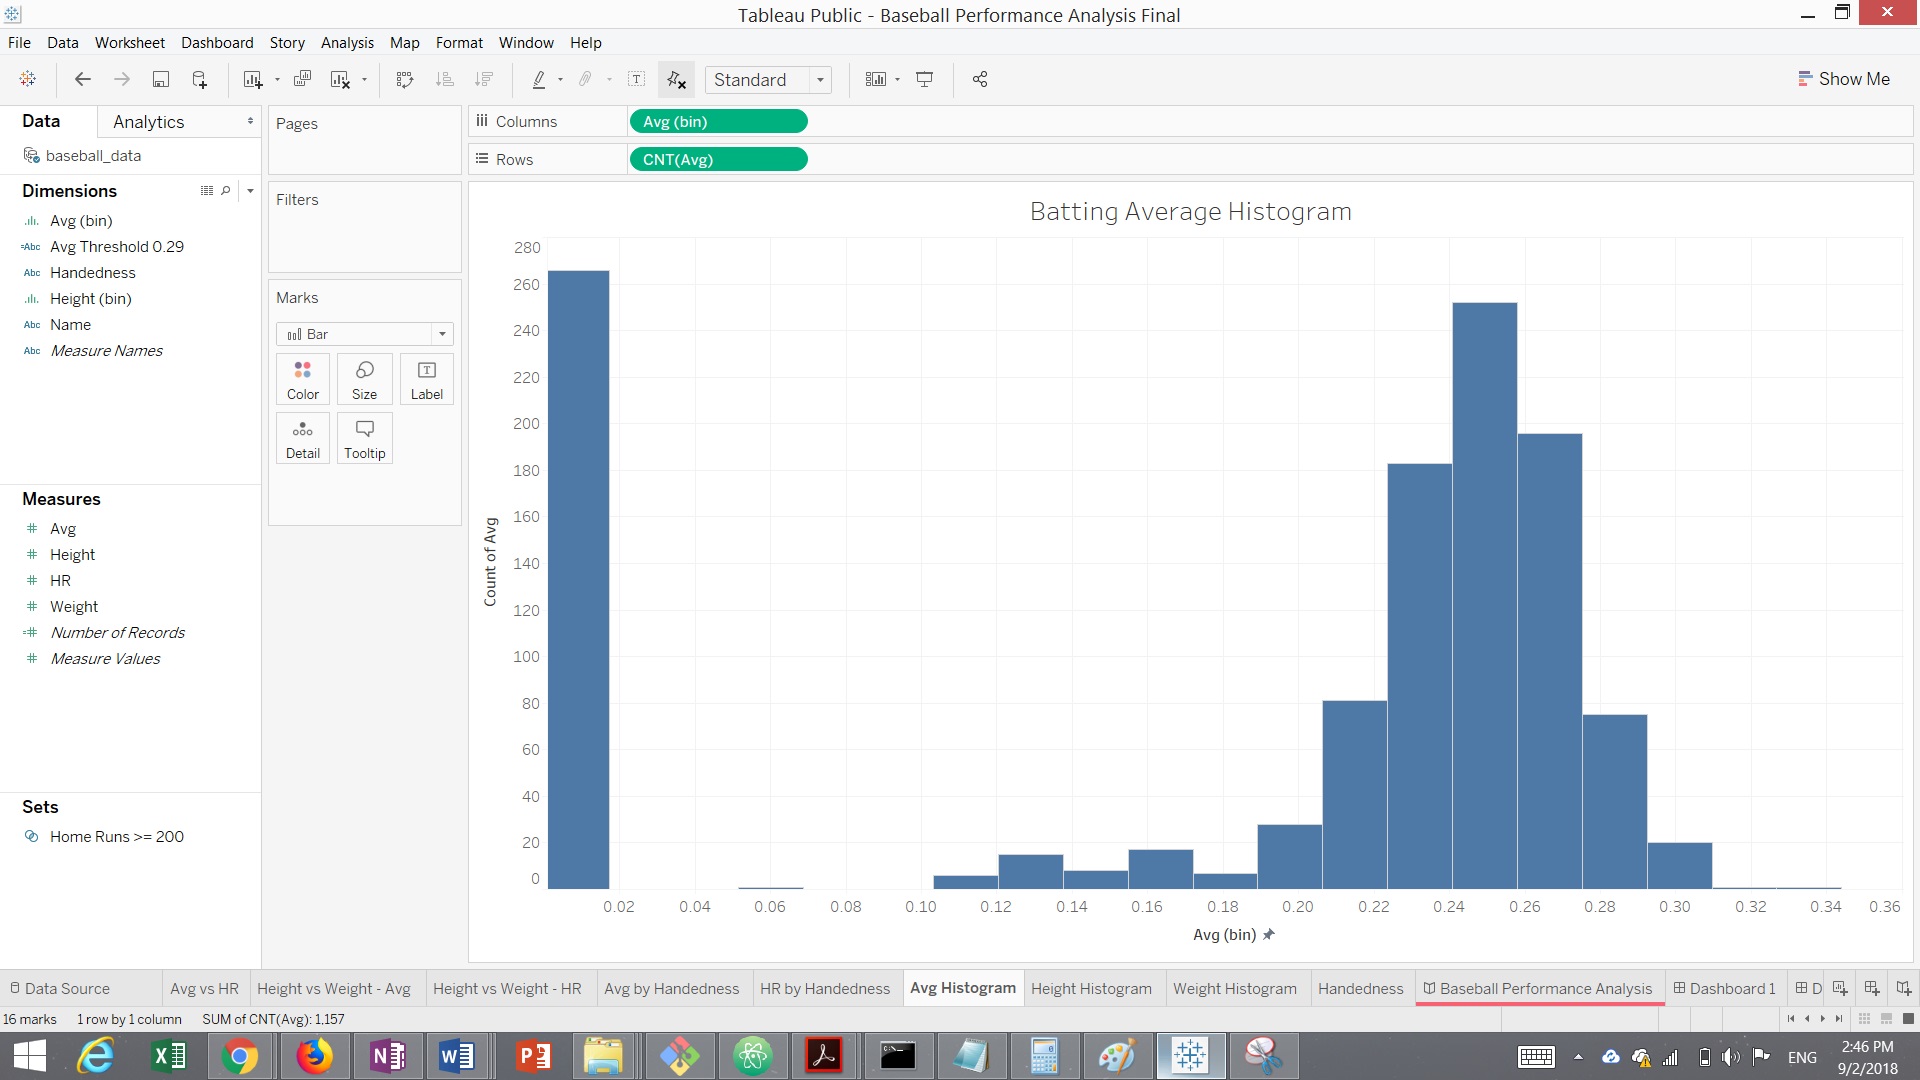
Batting Average Histogram: Edited the X-axis and limited the max value to 0.36, which helped in zooming in on the data and creating appropriate bins
-
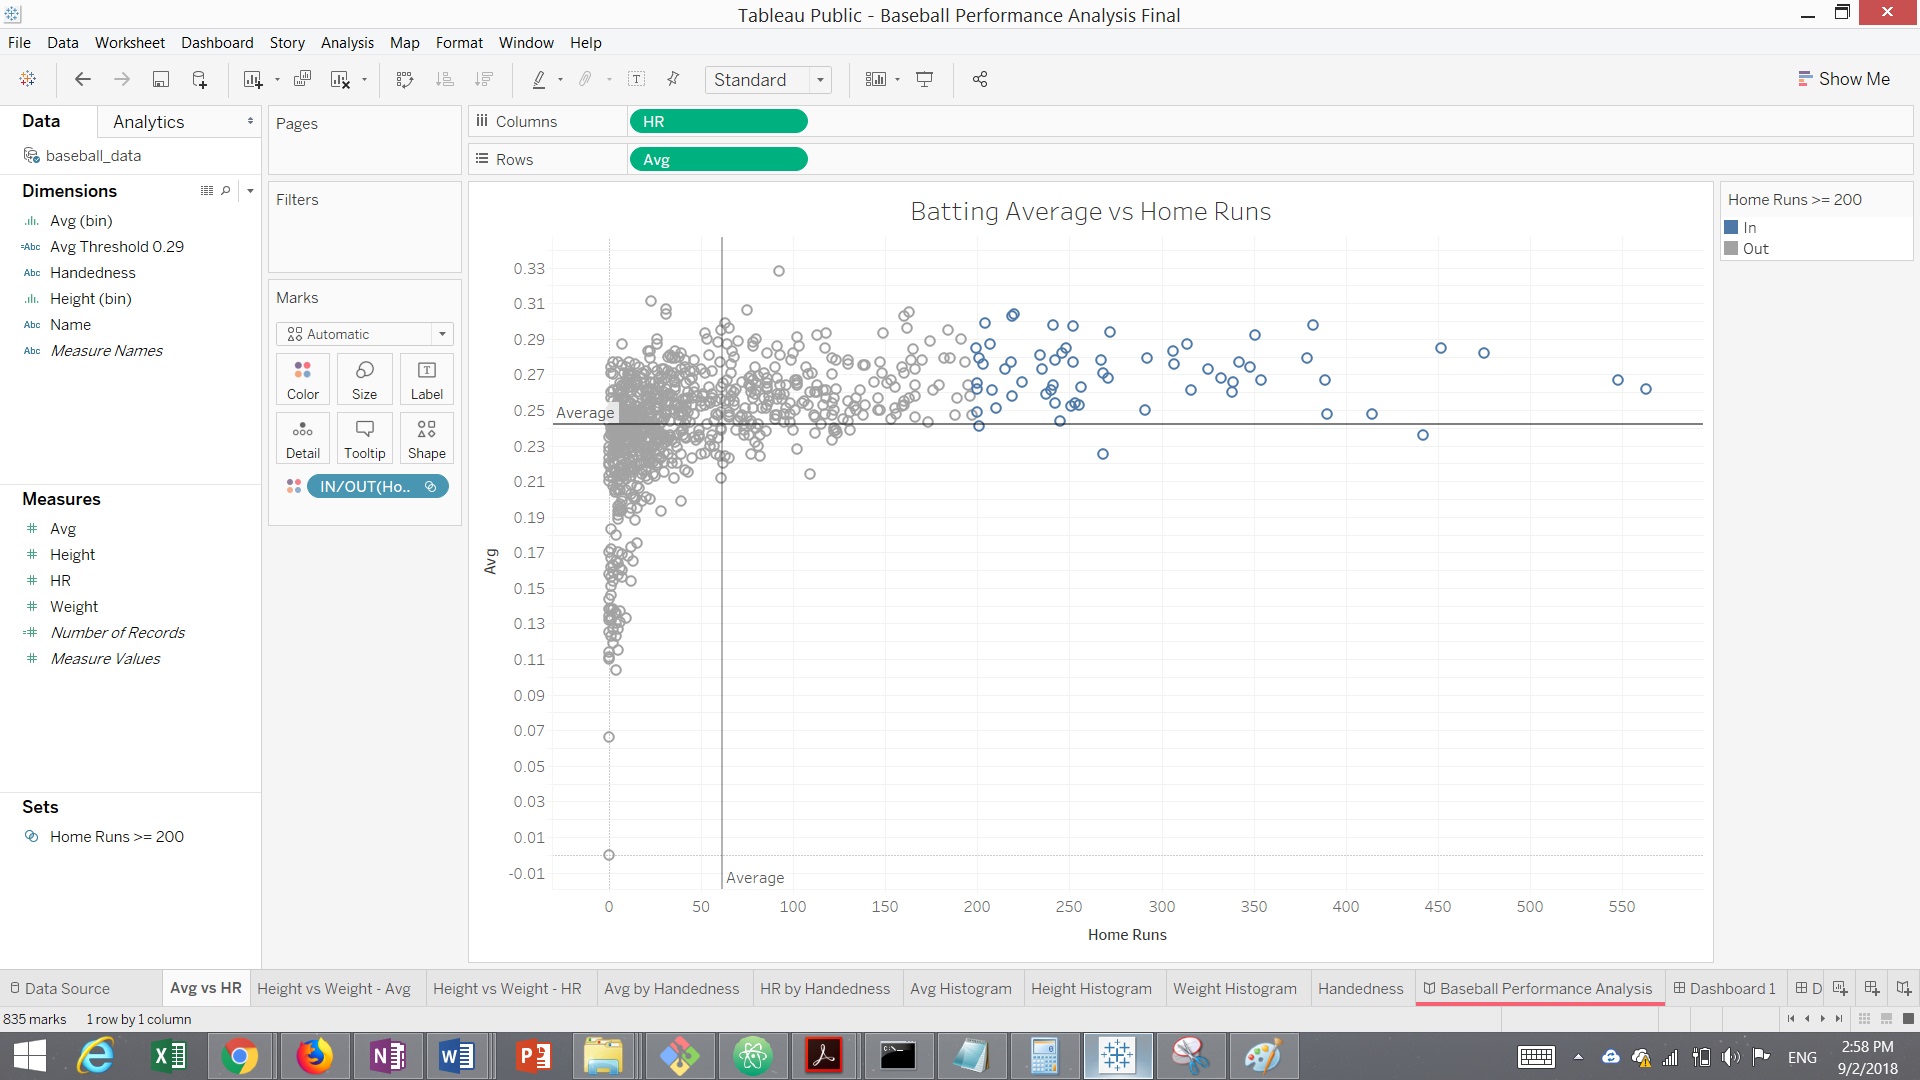
Batting Average vs Home Runs Scatter Plot: Created a set and used it to color the data points to highlight the insight provided in the story. Also, added the reference lines for average for both X and Y axis for reference.
-
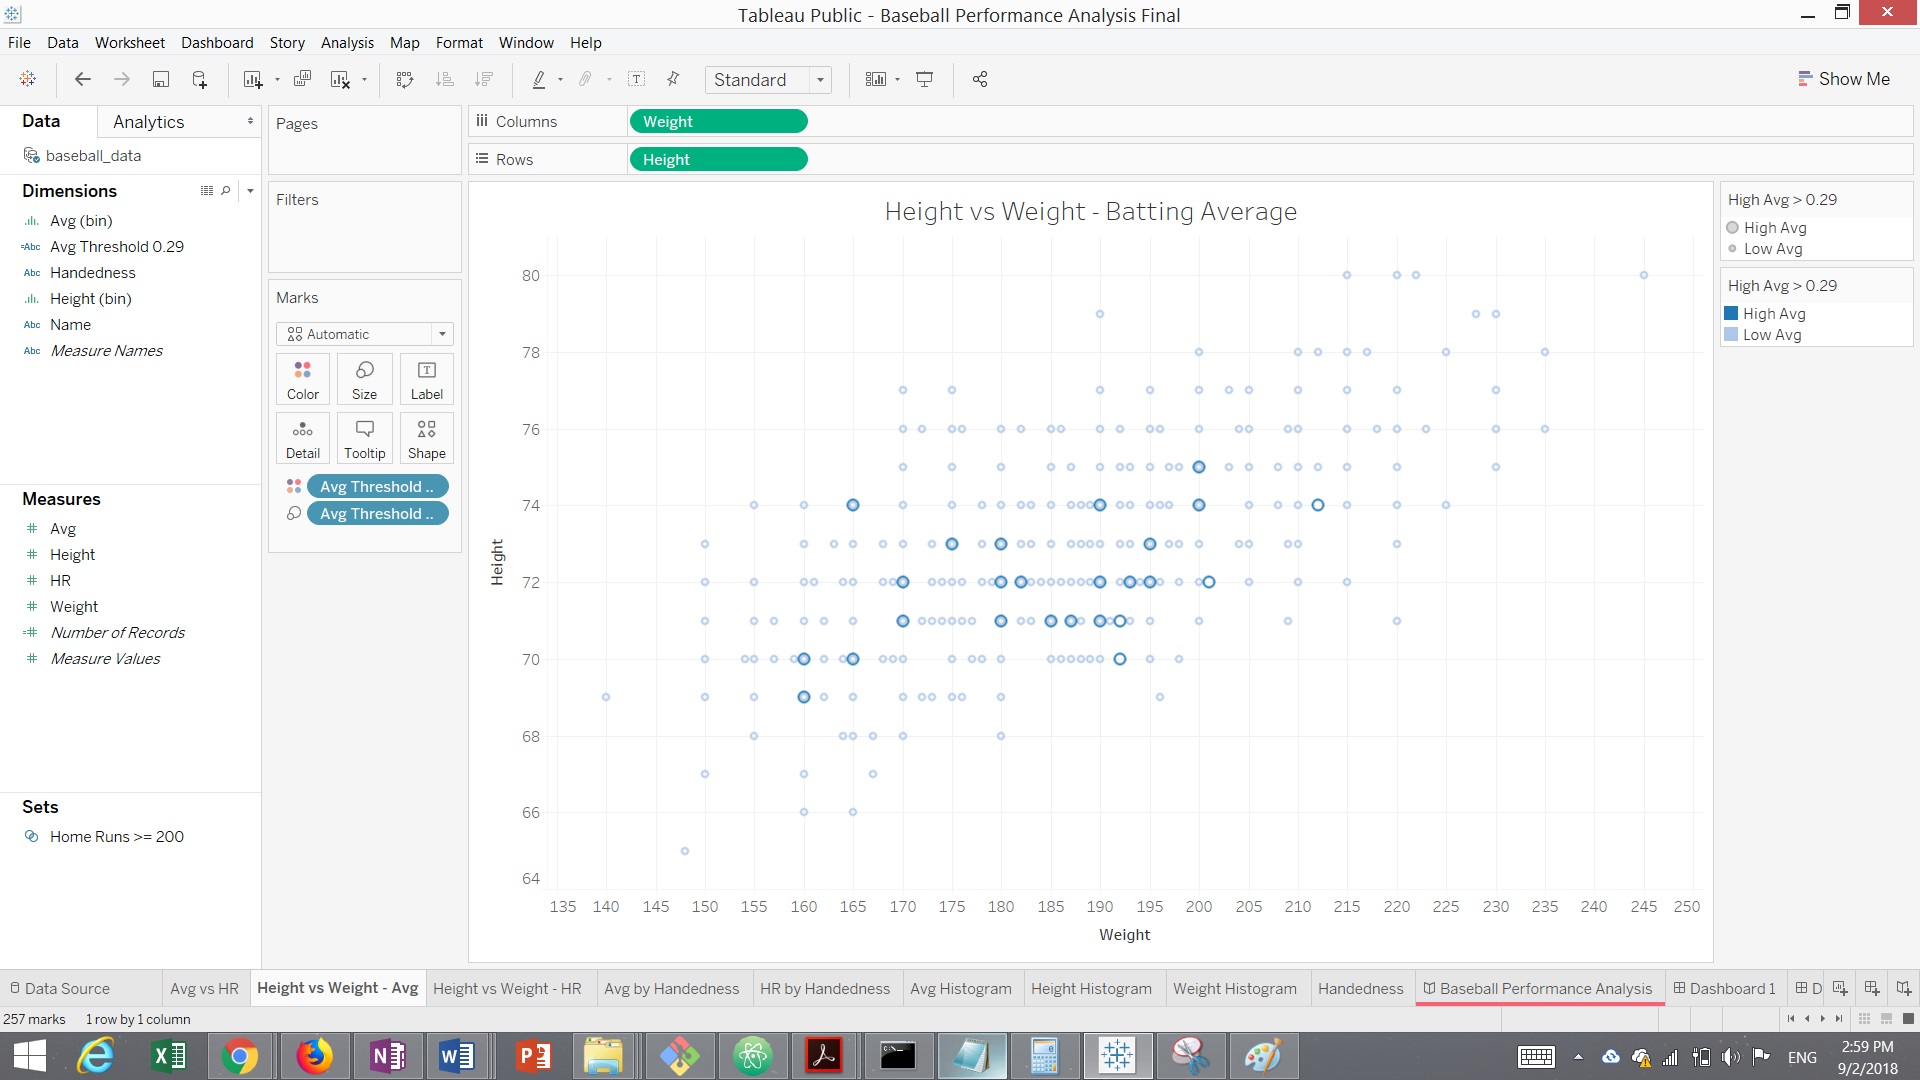
Height vs Weight Scatter Plot: Created a calculated field using the batting average to divide the batting average into high and low category. In addition to the coloring the data points by this field, I changed the size of the bubble using this field. This helped in highlighting the high average data points more clearly.
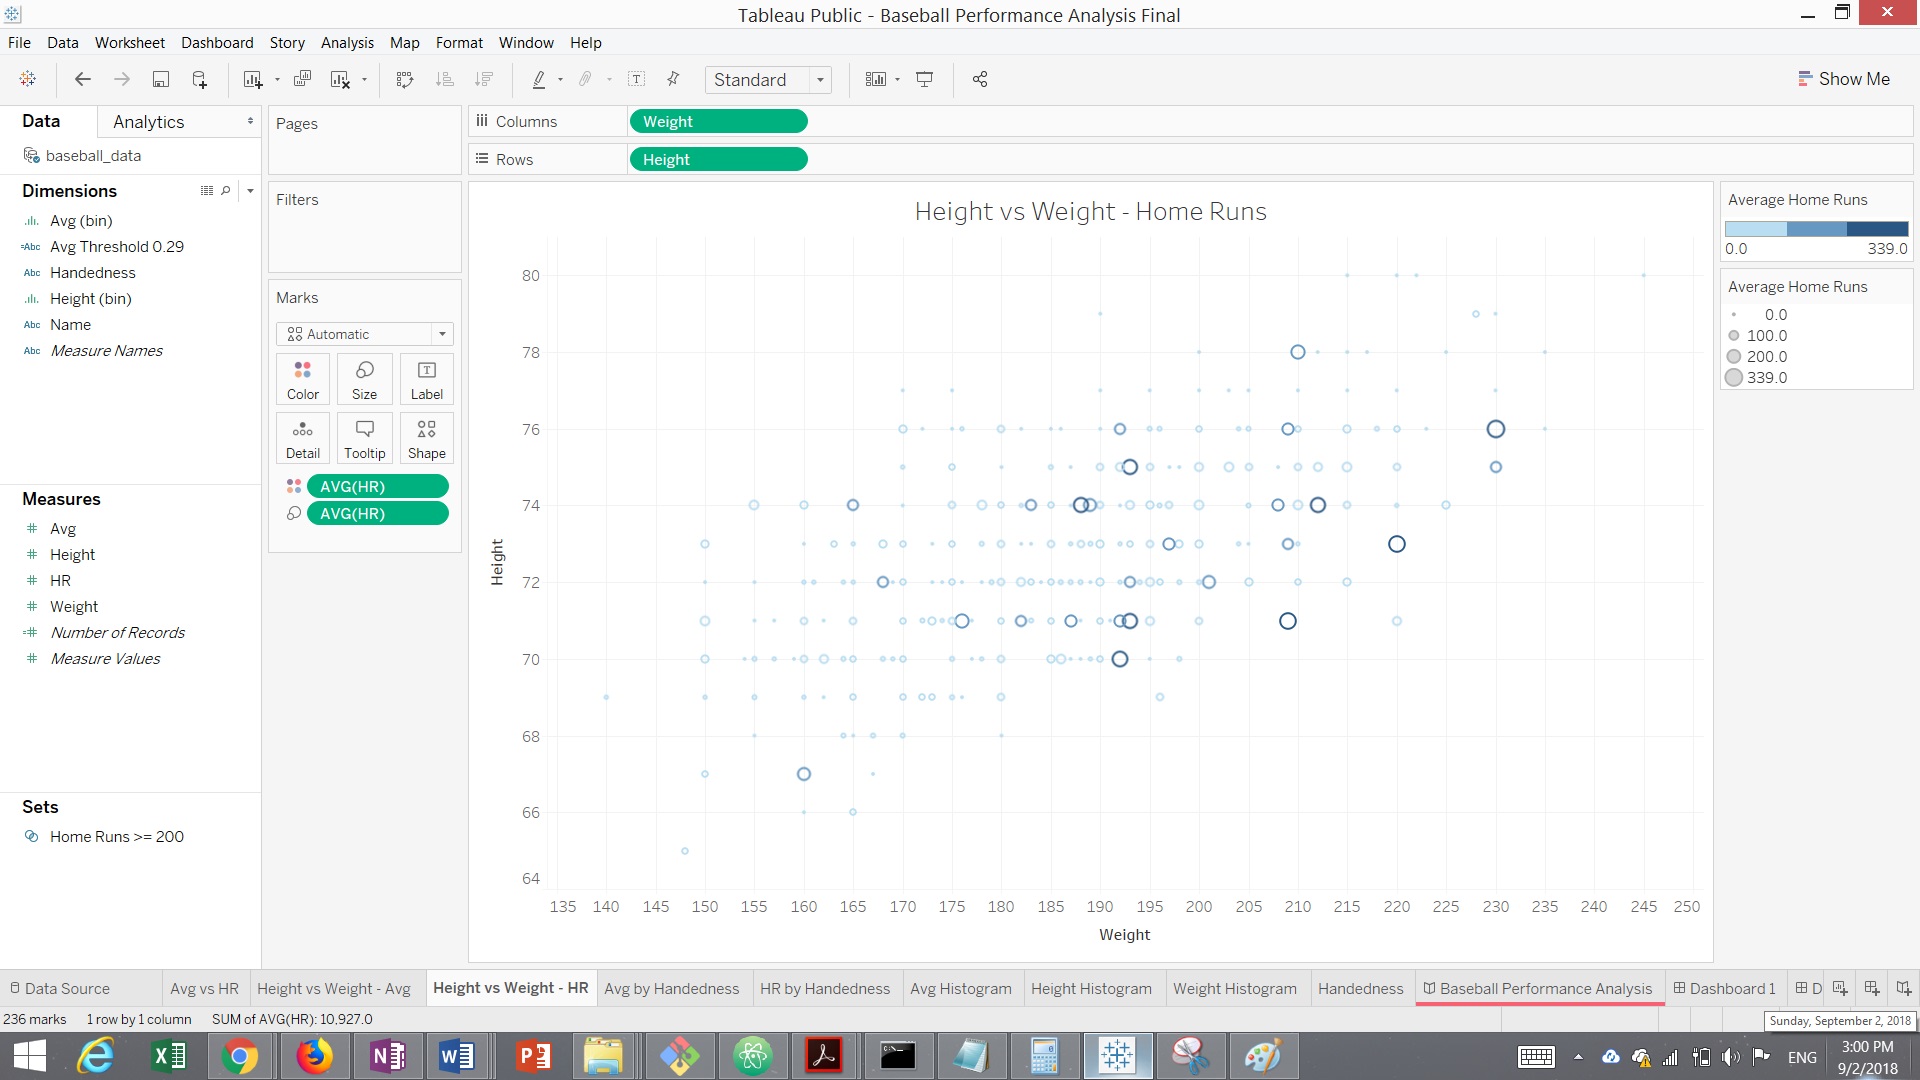
 Used color and size to highlight the home run categories on the height vs weight scatter plot as well to support the story insight
Conclusion:
- Home Runs: Players hitting high number of home runs tend to have an above average height and weight. Also, left handed players have hit more home runs as compared to right or both handed players
- Batting Average: Players hitting high number of home runs (greater than 200), tend to have at least an above average batting average (greater than 0.25). Also, players having a high batting average tend to fall in the median range of height and weight.