
Stroop Effect
Overview
In this project, I investigate a classic phenomenon from experimental psychology called the Stroop Effect. I create a hypothesis regarding the outcome of the task, then look at some data collected from others who have performed the same task and compute some statistics describing the results. Finally, I interpret the results in terms of the hypotheses.
Experiment Setup
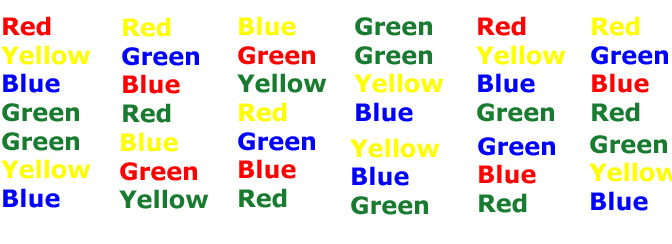
In a Stroop task, participants are presented with a list of words, with each word displayed in a color of ink. The participant’s task is to say out loud the color of the ink in which the word is printed. The task has two conditions: a congruent words condition, and an incongruent words condition. In the congruent words condition, the words being displayed are color words whose names match the colors in which they are printed. In the incongruent words condition, the words displayed are color words whose names do not match the colors in which they are printed. In each case, we measure the time it takes to name the ink colors in equally-sized lists. Each participant will go through and record a time from each condition.
Data
Identify variables
- Independent variable – Congruent (c) / Incongruent (i)
- Dependent variable – Time recorded to read the words
Hypothesis
- Ηο: μ1 = μ2 (The difference between the population mean time to read congruent and incongruent words is NOT statistically significant)
- Η1: μ1 ≠ μ2 (The difference between the population mean time to read congruent and incongruent words is statistically significant)
Dependent t-test for paired samples, two-tailed:
- One dependent variable which is of the type ratio (ranks with equal intervals and an absolute 0)
- One categorical variable with two related groups (same participants tested more than once)
- t-test because: The sample size is less than 30 and the σ of the entire population is unknown.
- Two-tailed because: I want to be sensitive to the difference in either direction (positive or negative)
- Assumptions
- Differences between the scores of the two populations is approximately normal
- Sample data can estimate population variances
- Population variances are approximately equal
Descriptive Statistics:
- Sample Measure Congruent Incongruent
- Mean:
- Congruent: 14.05
- Incongruent: 22.01
- Median:
- Congruent: 14.35
- Incongruent: 21.02
- Standard Deviation:
- Congruent: 3.56
- Incongruent: 4.80
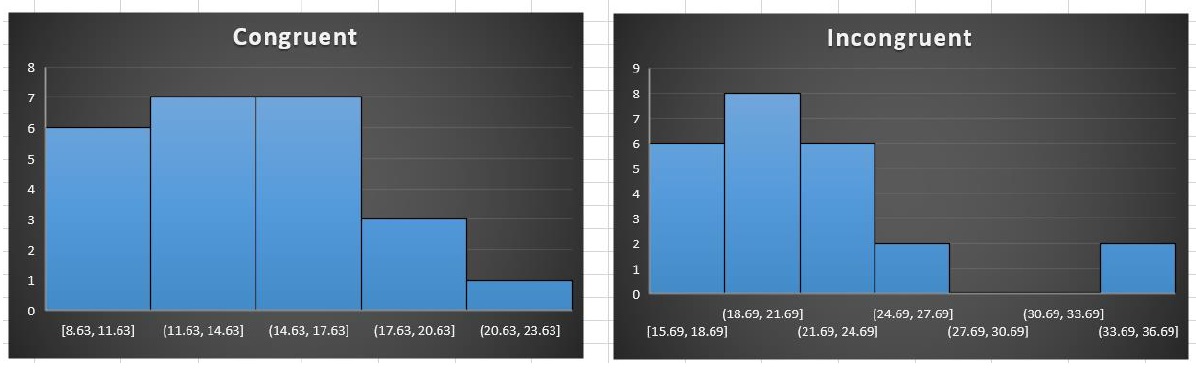
Distribution:
-
Histogram - Neither distribution is completely normal
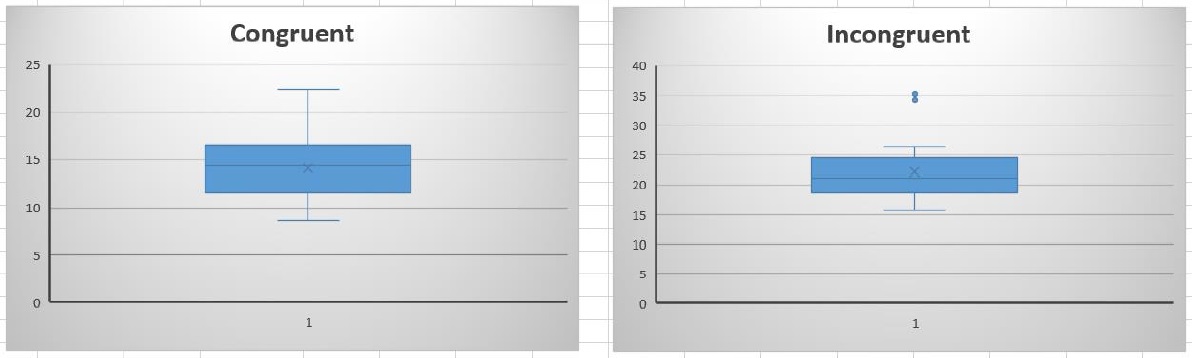
-
Box plot – There seem to be outliers in the incongruent data set
Result:
- t(23) = 8.02, p = .05, two-tailed
- t-stat = (mean(a) - mean(b)) / (standard_deviation(a - b)/square_root(N)
- SE = standard_deviation(a-b)/sqrt N = 4.86/sqrt(24) = .992
- t-stat = 7.96/.992 = 8.02
- Confidence level is 95% (p = .05)
- Critical t-score (p = .05, df = 23, two tailed): 2.069
- Reject Null Hypothesis: Since the t-score is higher than the critical value, the difference is statistically significant
- Conclusion: By looking at the sample data we can infer that for the population the average time for reading the colors of incongruent words is higher than the average time for reading the colors of congruent words.
Explanation for stroop affect
- Speed of Processing Theory: the interference occurs because words are read faster than colors are named, which could be because of different parts of brain processing the information
- We are depending on speech to understand if we have identified the color. Speech might be more closely associated with text rather than color. So we might be identifying both simultaneously, but are only able to say text faster.